Spectral overlap refers to the phenomenon when a fluorochromes exhibits fluorescence that “spills over” into a detector channel where it is not expected to show up. This occurs because most fluorochromes have very broad emission spectra. If you are not familiar with this concept, take a look at the fictional example below:
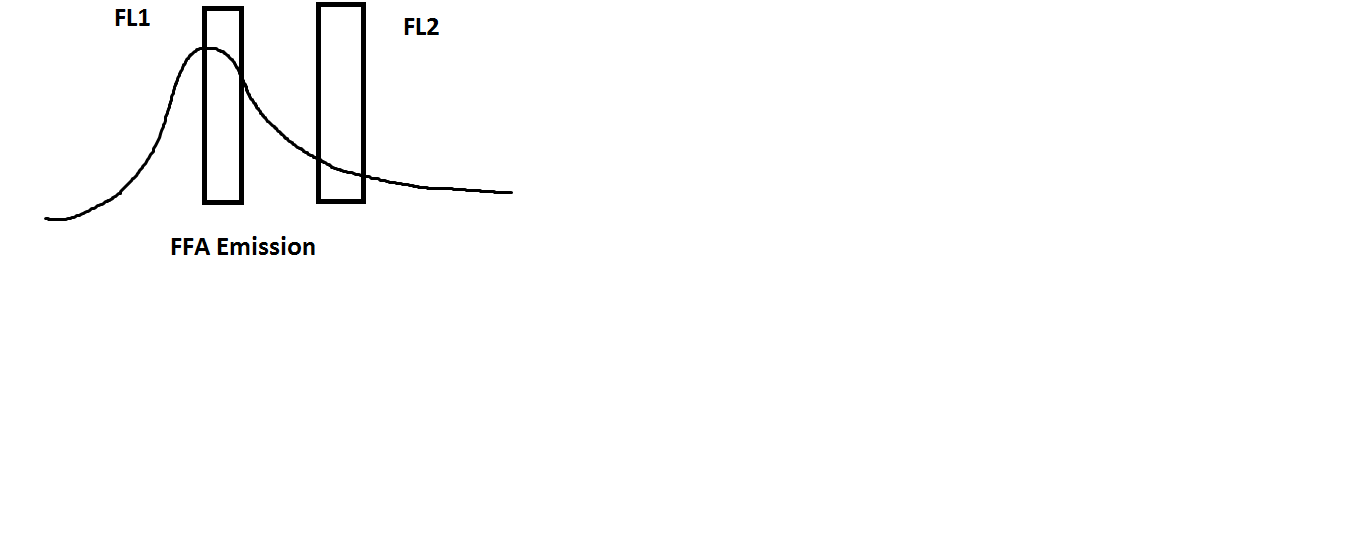
Fictional Fluorochrome A (FFA) has been excited by the 488nm blue laser. You know that it’s maximum emission is 518nm–right in the range of the FL1 detector on the BDAccuri C6. However, FFA has a very broad emission spectrum, and some of it’s fluorescence is captured by the FL2 detector as well. (For this purposes of this discussion, let’s consider the FL1 detector to be green fluorescence and the FL2 detector to the red fluorescence).
Now, for a single-color experiment, this may not seem like it matters very much. Your data may look like this:
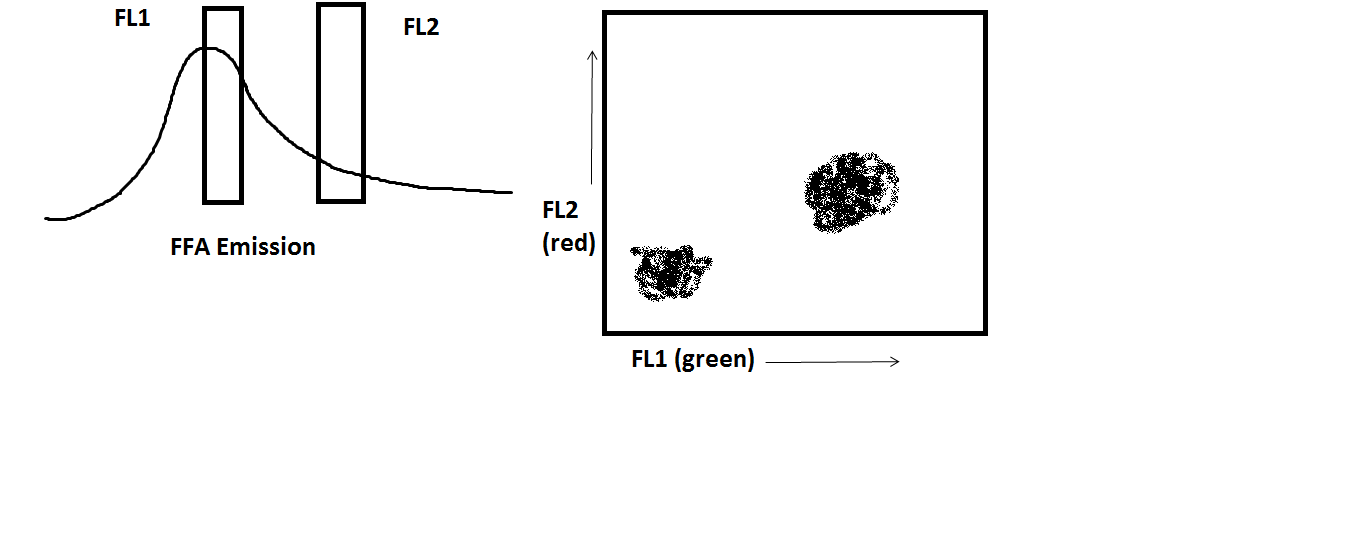
Again, it may not seem to matter very much. However, your “green” data look like they are slightly “red” as well. You know that they are not (assume that you ran the appropriate controls to determine this fact, of course), and so it is necessary to correct this fluorescence spillover so that your fluorescence data are accurate.
Still not convinced? Let’s say we have a sample that is stained with two fluorochromes: our first choice, FFA (which, if we remember, is green), and a new fluorochrome, FFB. FFB excites at 575nm, which is perfect for capture on the FL2 detector of the BDAccuri C6. Let’s see what our fluorescence spectra look like now:
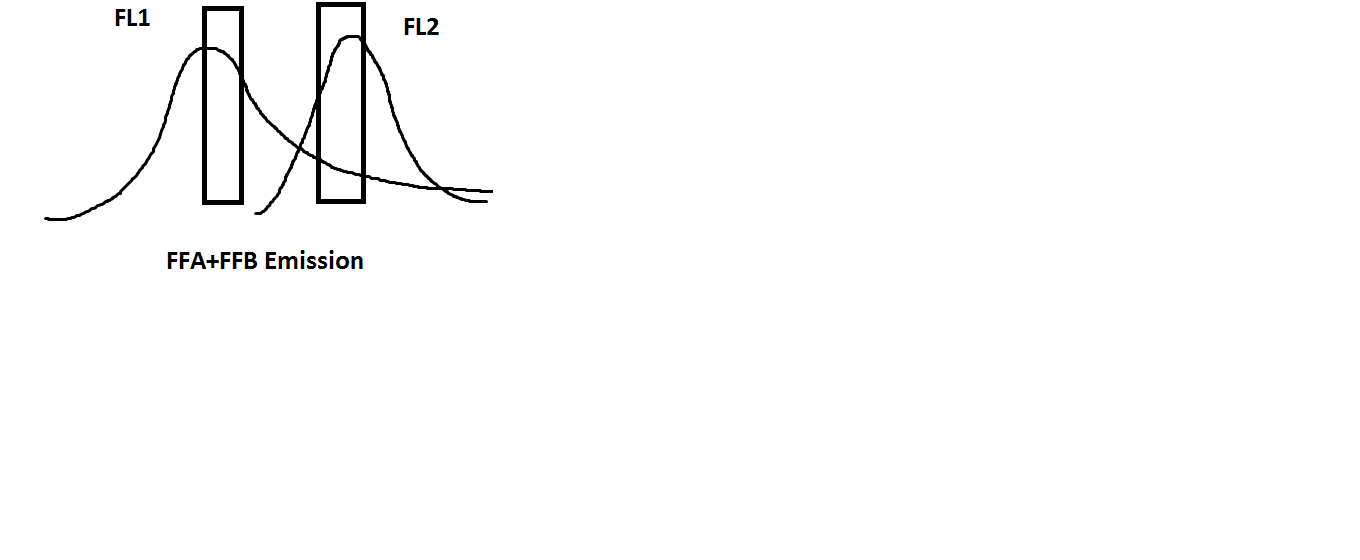
Now we see that the spectra for FFA and FFB are overlapping. Thus, what is being captured by FL2 is a combination of fluorescence by FFB and contamination by FFA. Correcting the fluorescence spillover now becomes necessary for the data to be correct.
The process of correcting fluorescence spillover on an instrument is called compensation. It involves accounting for the amount of contamination in a certain channel due to a fluorochrome that, essentially, doesn’t belong there. Uncorrected data might look like this:
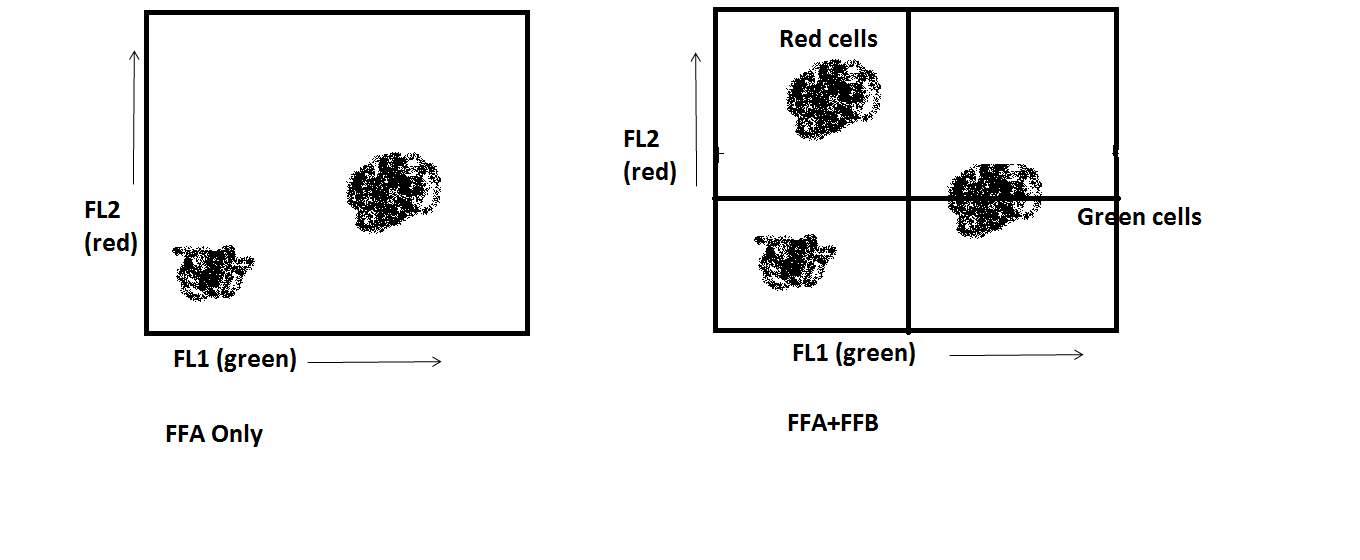
The cells which we know are green-only appear to be double positive: red and green both. Through compensation (a process which is calculated in the software), the data can be manipulated so that the cells which we know are green-only appear as such: only green.
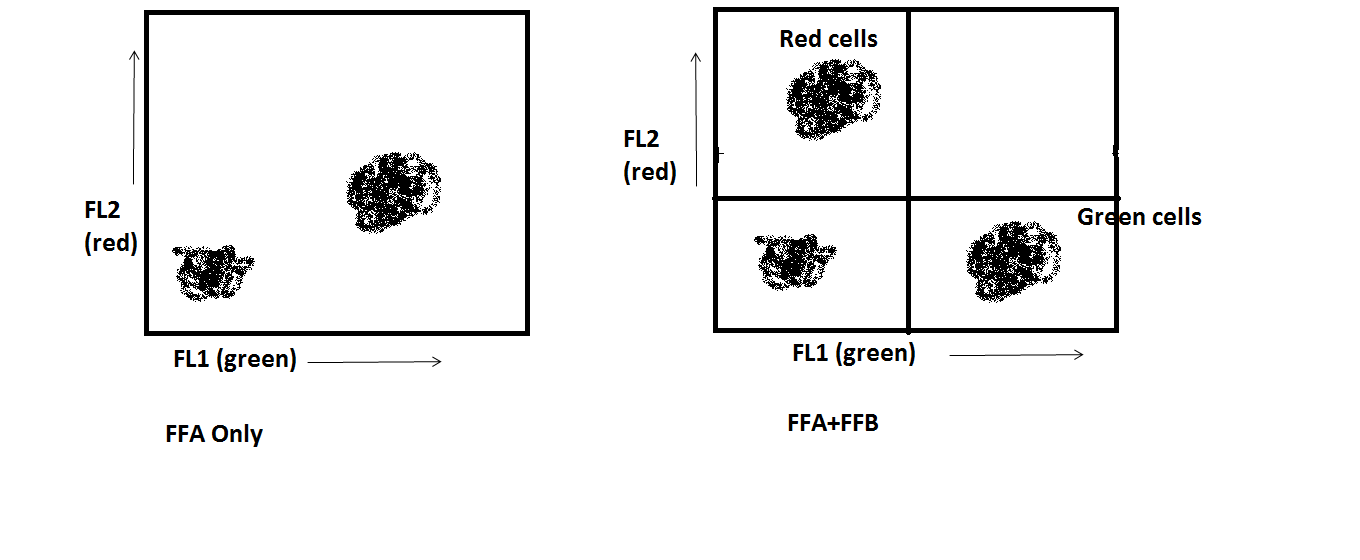
Now the two populations appear as we know that they are: the cells only stained with FFA are only green, and the cells only stained with FFB are only red. The instrument has been correctly compensated.
Compensation depends upon having single-color stained controls as well as unstained controls available. Without these, accurate data collection is impossible. Please make sure you are bringing the appropriate controls to your reserved time(s) with the instruments.
BD has a technical bulletin called An Introduction to Compensation for Multicolor Assays on Digital Cytometers. It is very informative and useful for understanding compensation on modern cytometers.
Fluorescence spillover can be an issue when designing experiements. The BD SpectraViewer can show you spillover that will occur when using two fluorochromes in combination in the same assay.
As always, please contact the operator for new experimental designs or for any questions you may have involving fluorescence spillover or compensation.